Table of Contents
Introduction
Website performance testing tools help you measure how fast, stable, and reliable your site is under real-world conditions. These tools analyze loading speed, server response time, user experience, and overall system behavior to ensure your website performs smoothly across devices and traffic levels. By identifying bottlenecks such as slow scripts, large files, or server delays, performance testing tools allow businesses to optimize speed, enhance user satisfaction, and improve search engine rankings. Whether you’re running a small blog or a large enterprise platform, these tools provide valuable insights to maintain high performance, prevent downtime, and support scalability as your website grows.
What Are Website Performance Testing Tools?

Website performance testing tools are specialized software solutions designed to evaluate how efficiently a website operates under various conditions. They measure key factors like page load speed, server response time, resource usage, and overall user experience. These tools simulate real user interactions, different network speeds, and traffic volumes to uncover performance issues that may slow down your website or create bottlenecks. By offering detailed reports and metrics, they help developers and businesses diagnose problems before they impact visitors.
Beyond basic speed checks, performance testing tools support stress testing, load testing, and continuous monitoring. This helps ensure that your website remains stable even during peak traffic periods or sudden user spikes. They also guide optimization efforts by highlighting inefficient code, large media files, or server-side delays. For businesses, using these tools is essential for delivering fast, reliable, and scalable digital experiences that retain users and improve overall engagement.
10 Best Website Performance Testing Tools for 2025
1. Google PageSpeed Insights
Overview
Google PageSpeed Insights is a widely trusted Website performance testing tool that measures website speed and overall user experience using Google Lighthouse and Core Web Vitals. It evaluates both mobile and desktop performance, providing granular insights into loading behavior, visual stability, and interactivity. As a Google-owned tool, it aligns closely with SEO ranking factors, making it essential for businesses aiming to improve visibility, mobile responsiveness, and search performance.
Key Features
Measures Core Web Vitals
Mobile and desktop analysis
Google Lighthouse-powered metrics
Optimization suggestions
Diagnostics and audits
Free and instant reports
Why Choose Us
Choose Google PageSpeed Insights if you want an authoritative performance assessment directly aligned with Google’s search ranking criteria. It helps you identify speed bottlenecks, improve Core Web Vitals, and enhance mobile experience—all essential for SEO developer success. Its clear recommendations, zero cost, and instant results make it the perfect starting point for developers, marketers, and business owners optimizing website performance.
2. GTmetrix

Overview:
GTmetrix is an advanced Website performance testing tool combining Lighthouse metrics with its own structured insights to deliver a deep analysis of website behavior. It provides detailed waterfall charts, video playback, and multi-location testing to help you understand how each element affects loading speed. GTmetrix is ideal for diagnosing performance issues at a granular level, especially for teams needing transparent, visualized data.
Key Features
Lighthouse-based scoring
Global test locations
Waterfall analysis
Video playback
Scheduled monitoring
Optimization recommendations
Why Choose Us
Choose GTmetrix for highly visual, in-depth performance insights that simplify complex diagnostics. Its filmstrip and waterfall views help pinpoint slow resources quickly, making optimization efficient. With monitoring, alerts, and multi-region testing, GTmetrix is perfect for businesses targeting global audiences and developers who need precise, technical performance breakdowns.
3. Pingdom
Overview:
Pingdom is a powerful, user-friendly tool designed for ongoing website performance monitoring and user experience analysis. It tests your site from multiple global locations and provides easy-to-understand performance grades, waterfall charts, and uptime data. With real user monitoring (RUM) and synthetic testing combined, Pingdom offers a complete view of real-world performance and long-term stability.
Key Features
Global speed tests
Uptime monitoring
RUM capabilities
Waterfall charts
Alerts and reporting
Transaction monitoring
Why Choose Us
Pingdom is ideal for businesses that need continuous insight into website performance and uptime reliability. Its friendly interface, accurate global testing, and strong monitoring features make it perfect for teams prioritizing real-time alerts and long-term performance tracking. With both RUM and synthetic tests, you can ensure a smooth user experience around the clock.
4. WebPageTest
Overview:
WebPageTest is one of the most technically robust Website performance Testing tools for developers and analysts. It provides advanced multi-step transaction testing, real browser simulations, and network throttling options. With detailed waterfall charts, filmstrip comparisons, and deep diagnostics, it replicates real-world user scenarios with exceptional accuracy—making it invaluable for performance engineering teams.
Key Features
Real browser testing
3G/4G/5G throttling
Multi-step testing
Filmstrip/video comparison
Waterfall charts
Advanced technical metrics
Why Choose Us
Choose WebPageTest if you need highly detailed, developer-focused insights that go beyond basic speed testing. Its real-browser simulations and advanced metrics help uncover bottlenecks other tools miss. From custom test scripting to multi-step flows, it’s built for technical teams who want exact performance behavior under different network and device conditions.
5. PFLB
Overview:
PFLB is a professional load and Website performance testing tool tailored for enterprise-scale applications and websites. It simulates realistic user traffic, stress conditions, and peak loads to ensure your digital infrastructure can handle heavy demand. PFLB is ideal for businesses managing mission-critical applications that require precise performance validation under intense user activity.
Key Features
Large-scale load testing
Cloud and on-prem options
Realistic behavior simulation
CI/CD integration
Detailed analytics
Enterprise readiness
Why Choose Us
PFLB is perfect for organizations expecting high traffic or preparing for major launches. Its ability to simulate real-world scenarios at scale helps uncover vulnerabilities before they impact users. With enterprise-focused features, automation, and advanced reporting, it ensures your site stays stable, efficient, and reliable under extreme workload conditions.
6. Yellow Lab Tools

Overview:
Yellow Lab Tools is a specialized open-source tool focused on frontend performance, code quality, and structural efficiency. It analyzes DOM complexity, CSS weight, script behavior, and accessibility issues to evaluate how frontend development impacts performance. Its unique scoring system helps teams detect and fix frontend bottlenecks that traditional speed tools may overlook.
Key Features
Frontend performance analysis
DOM and CSS breakdowns
Accessibility checks
Unique scoring system
Free and open-source
Script and layout diagnostics
Why Choose Us
Choose Yellow Lab Tools if your focus is frontend optimization and code quality improvement. It highlights structural issues like oversized DOMs, heavy stylesheets, or inefficient scripts that slow down rendering. Perfect for frontend developers, it offers insights that complement traditional speed metrics to create cleaner, faster, and more efficient websites.
7. KeyCDN Website Testing Tools
Overview:
KeyCDN provides a suite of free, lightweight website performance testing tools optimized for global content delivery. With tests for speed, HTTP/2, TLS, ping, and image optimization, it helps developers diagnose performance from a CDN perspective. Its worldwide testing nodes allow accurate measurement of how fast content loads across different regions.
Key Features
Global speed testing
HTTP/2 and TLS tests
Ping/traceroute tools
Image optimization checks
CDN-centric diagnostics
Free and fast tools
Why Choose Us
Choose KeyCDN tools if you want quick, accurate global performance insights without heavy complexity. It’s ideal for checking CDN efficiency, latency, and regional performance. Simple, fast, and free, it helps developers quickly identify global delivery issues, making it great for international websites and globally distributed audiences.
8. Dotcom-Monitor
Overview:
Dotcom-Monitor is a full-suite performance and uptime monitoring platform offering deep insights through real-browser testing, load testing, API monitoring, and global speed checks. With more than 25 worldwide locations and support for Chrome, Firefox, and mobile browsers, it offers a complete evaluation of website reliability and responsiveness.
Key Features
Real browser testing
Global testing nodes
Load/stress testing
API monitoring
Filmstrip and waterfall
Synthetic monitoring
Why Choose Us
Choose Dotcom-Monitor if you need enterprise-level monitoring and testing across multiple environments—websites, servers, APIs, and applications. Its global testing capabilities and detailed analytics ensure you catch performance issues early. Ideal for companies needing reliable, ongoing performance insights at scale.
9. Uptrends
Overview:
Uptrends is a user-friendly performance testing and monitoring platform offering website, API, and server monitoring with clean visuals and accurate regional data. It tests mobile and desktop performance, supports synthetic transactions, and provides intuitive dashboards that help teams quickly understand real-time performance behavior.
Key Features
Global speed testing
Mobile performance checks
Uptime monitoring
Waterfall analysis
Transaction testing
Team collaboration features
Why Choose Us
Choose Uptrends if you want a visually clear, easy-to-use platform that supports both performance testing and long-term monitoring. It’s ideal for agencies, teams, and businesses needing collaborative dashboards, reliable alerts, and simple yet powerful performance insights.
10. LoadView
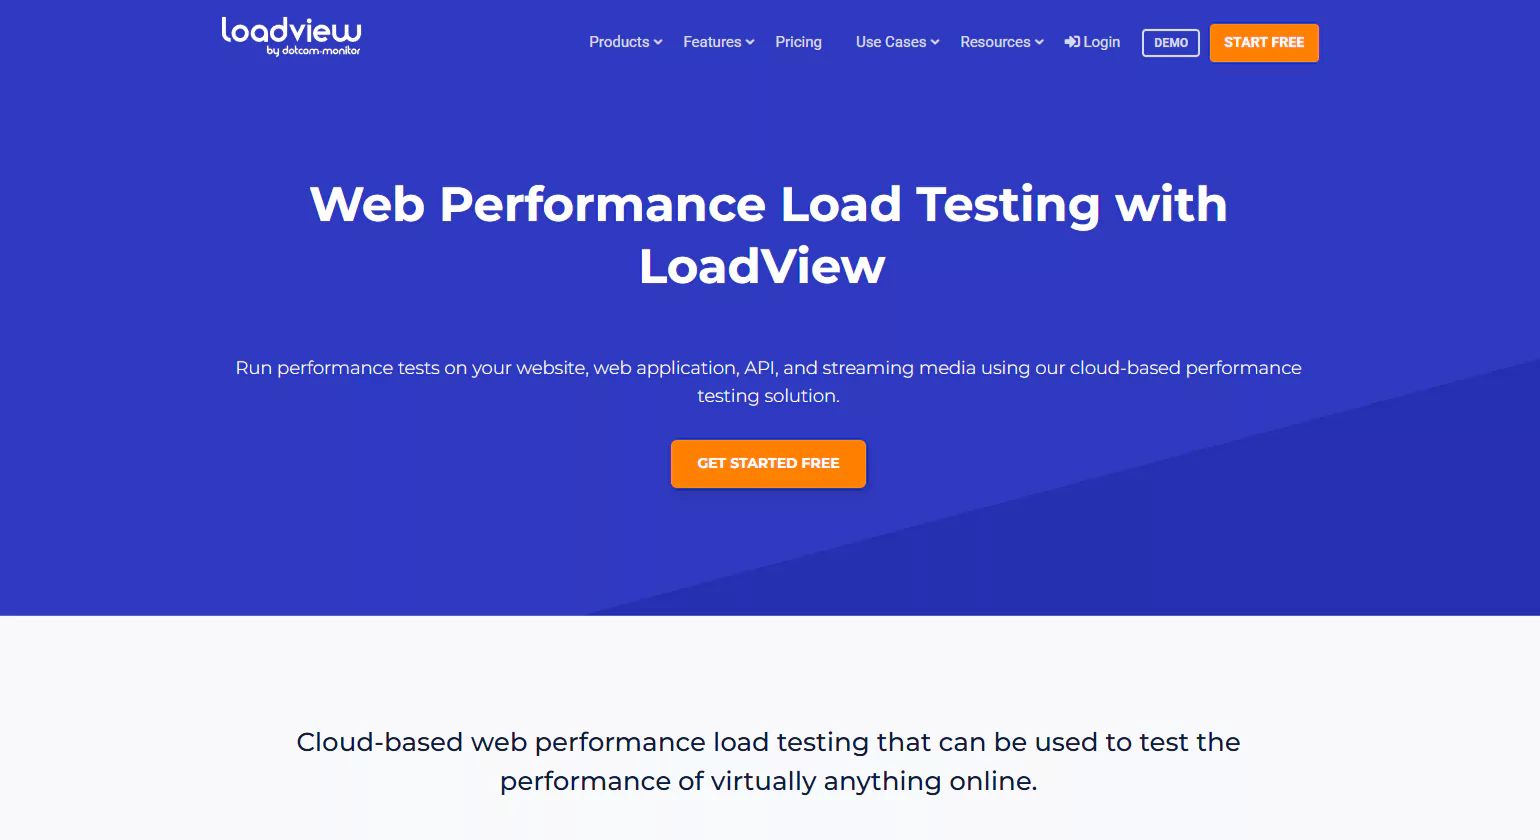
Overview:
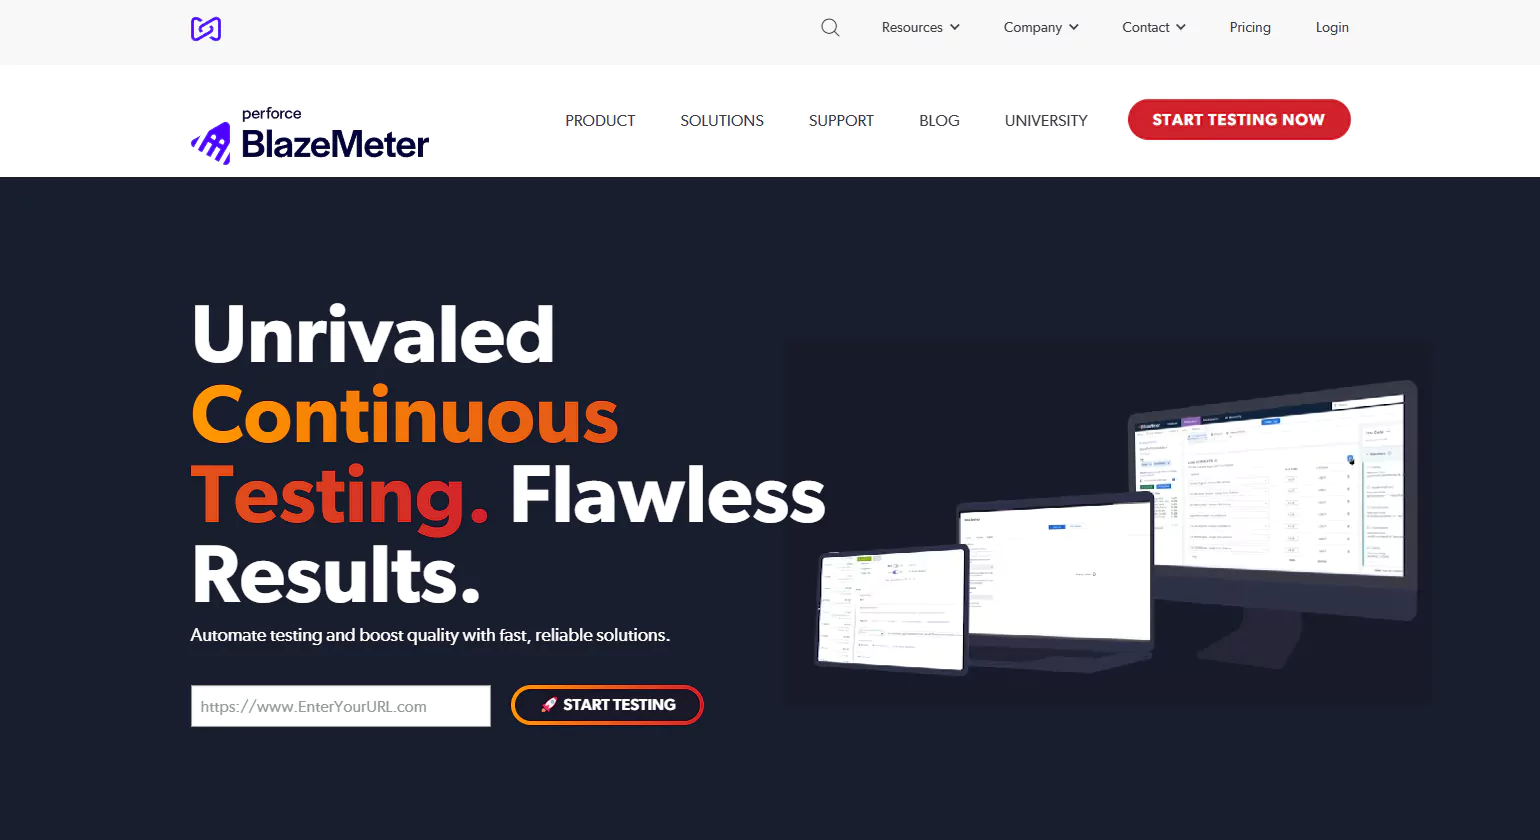
BlazeMeter is a high-performance platform built for large-scale load testing, API testing, performance monitoring, and DevOps integration. It supports JMeter, Gatling, Selenium, and other open-source tools, offering advanced capabilities for testing complex user flows and heavy traffic scenarios.
Key Features
Large-scale load testing
API and microservices tests
CI/CD integration
Real-time dashboards
Scriptless test creation
Multi-tool compatibility
Why Choose Us
Choose BlazeMeter if you operate within a DevOps or enterprise environment where continuous performance testing is essential. Its ability to run massive load tests, integrate with pipelines, and support open-source testing tools makes it ideal for engineering teams handling sophisticated applications and large-scale user activity.
Why Businesses Need Performance Testing Tools in 2025
performance testing monitoring tools is essential to ensure that a software application performs well under expected and peak workloads. It helps evaluate the system’s speed, responsiveness, stability, and scalability, which are critical for delivering a smooth and reliable user experience. Without performance testing, applications may suffer from slow load times, frequent crashes, or poor scalability, leading to user dissatisfaction and potential business loss.
One of the primary reasons for Website performance testing Tools is to identify bottlenecks in the system that could affect functionality under heavy traffic. It allows teams to understand how many users the application can support, how it behaves under stress, and whether it can recover from extreme conditions.
performance testing monitoring tools also helps in capacity planning, ensuring that the infrastructure can handle future growth. It verifies that the application meets performance benchmarks, compliance requirements, and service-level agreements (SLAs).
In addition, it plays a key role in risk mitigation. By testing early and regularly, teams can catch performance issues before they reach production, reducing the risk of downtime and costly post-release fixes.
How Do Performance Test Tools Work?

Performance test tools are essential for evaluating an application’s speed, stability, and scalability under various conditions. They simulate user traffic, monitor system behavior, and generate reports to identify potential bottlenecks.
Test Design and Planning
Website Performance testing tools allow testers to define and plan various test scenarios before execution. This stage includes determining specific goals for the test, such as response time targets, throughput rates, and the desired number of concurrent users. Users also decide whether they want to perform a load test, stress test, spike test, or endurance test. The test scripts are created based on realistic user behaviors, which could include browsing, making transactions, or downloading files, depending on the application being tested. These tools also provide the ability to customize test parameters based on the system’s expected usage.
Load Simulation
Once the test scenario is defined, performance tools simulate virtual users (VUs) or requests to the target application. These tools use scripts to replicate user behavior and interactions, such as browsing pages, clicking buttons, or performing searches. These virtual users are distributed across different geographic locations (if required), and the tool gradually increases the load to mimic real-world traffic spikes. The number of VUs can be adjusted based on the test objectives to simulate varying levels of traffic.
Real-Time Monitoring
During the execution of the performance test, monitoring tools track and measure various system metrics in real-time. These include server-side performance indicators like CPU usage, memory consumption, disk I/O, and database performance, as well as client-side metrics such as response time, page load times, and error rates. This real-time data is essential for identifying performance bottlenecks or areas where the system might fail under higher traffic conditions. Performance tools often provide dashboards that visually display key metrics, allowing testers to quickly spot potential issues.
Data Collection and Analysis
After the test is completed, the performance test tool collects a comprehensive set of data that includes response times, latency, request throughput, error rates, and system resource consumption. This data is analyzed to identify patterns and areas of concern, such as high response times or system crashes. Testers often look for performance thresholds, such as when the application starts to degrade in response time or when it reaches the breaking point under load. The tools also measure the system’s behavior over time, allowing testers to gauge how it handles prolonged periods of usage (e.g., during endurance tests).
Reporting and Visualization
After the data is gathered and analyzed, performance test tools generate detailed reports. These reports include a wide range of visualizations, such as graphs, charts, and tables, to make the results easy to understand. Key performance indicators (KPIs) are typically highlighted, including the 95th percentile response time, throughput (requests per second), and error rates. Testers can use these reports to compare the system’s performance against the predefined goals, such as whether it meets the desired response time under peak load conditions. Additionally, trends are often visualized to indicate if the application is performing consistently over time.
Comparison and Scaling
Performance test tools also enable testers to compare different system versions, configurations, or deployment environments. For example, after making changes to the application or infrastructure (such as adding more servers or optimizing the database), testers can run tests again to determine whether performance has improved. These tools also suggest strategies for scaling the system to handle higher loads, such as horizontal scaling (adding more servers) or vertical scaling (upgrading existing servers). By identifying where bottlenecks occur, these tools help optimize the system to improve efficiency and user experience under varying traffic conditions.
10 Different Types of Performance Testing Tools Explained

Best Performance test tools tools are essential for evaluating application speed, stability, and scalability under various conditions. These tools help organizations ensure their applications function optimally under different workloads.
1. LoadRunner
LoadRunner, developed by Micro Focus, is one of the most powerful and widely used tools for assessing system performance. It simulates thousands of virtual users to test applications’ behavior under different load conditions. LoadRunner supports a variety of protocols, including web, database, and SAP, making it suitable for complex enterprise-level applications. It generates detailed performance reports that help diagnose system bottlenecks and optimize performance.
2. JMeter
Apache JMeter is an open-source web performance testing tool that primarily focuses on load and stress testing web applications. It is highly customizable and supports numerous protocols, such as HTTP, HTTPS, FTP, JDBC, and more. JMeter is popular for its ease of use, extensibility, and integration with CI/CD pipelines. It also provides real-time monitoring and detailed analytics for identifying performance issues.
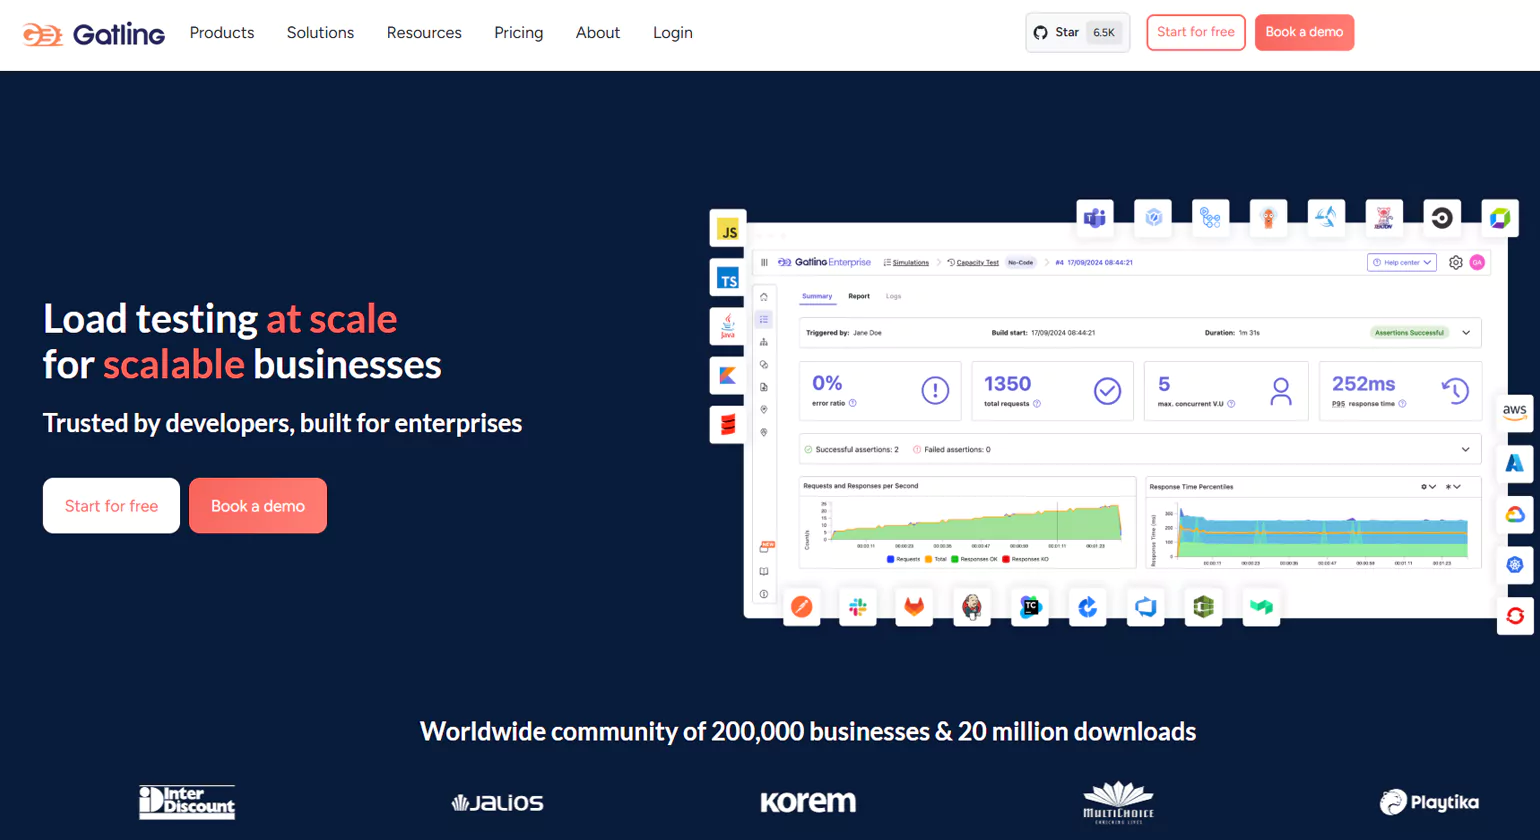
3. Gatling
Gatling is an open-source, high-performance load testing tool, designed to handle large-scale testing scenarios. It’s known for its advanced scripting capabilities using Scala, making it ideal for testers with coding expertise. Gatling supports HTTP, JMS, and WebSocket protocols, and offers detailed performance reports. Its integration with CI/CD tools makes it suitable for automated testing in agile environments.
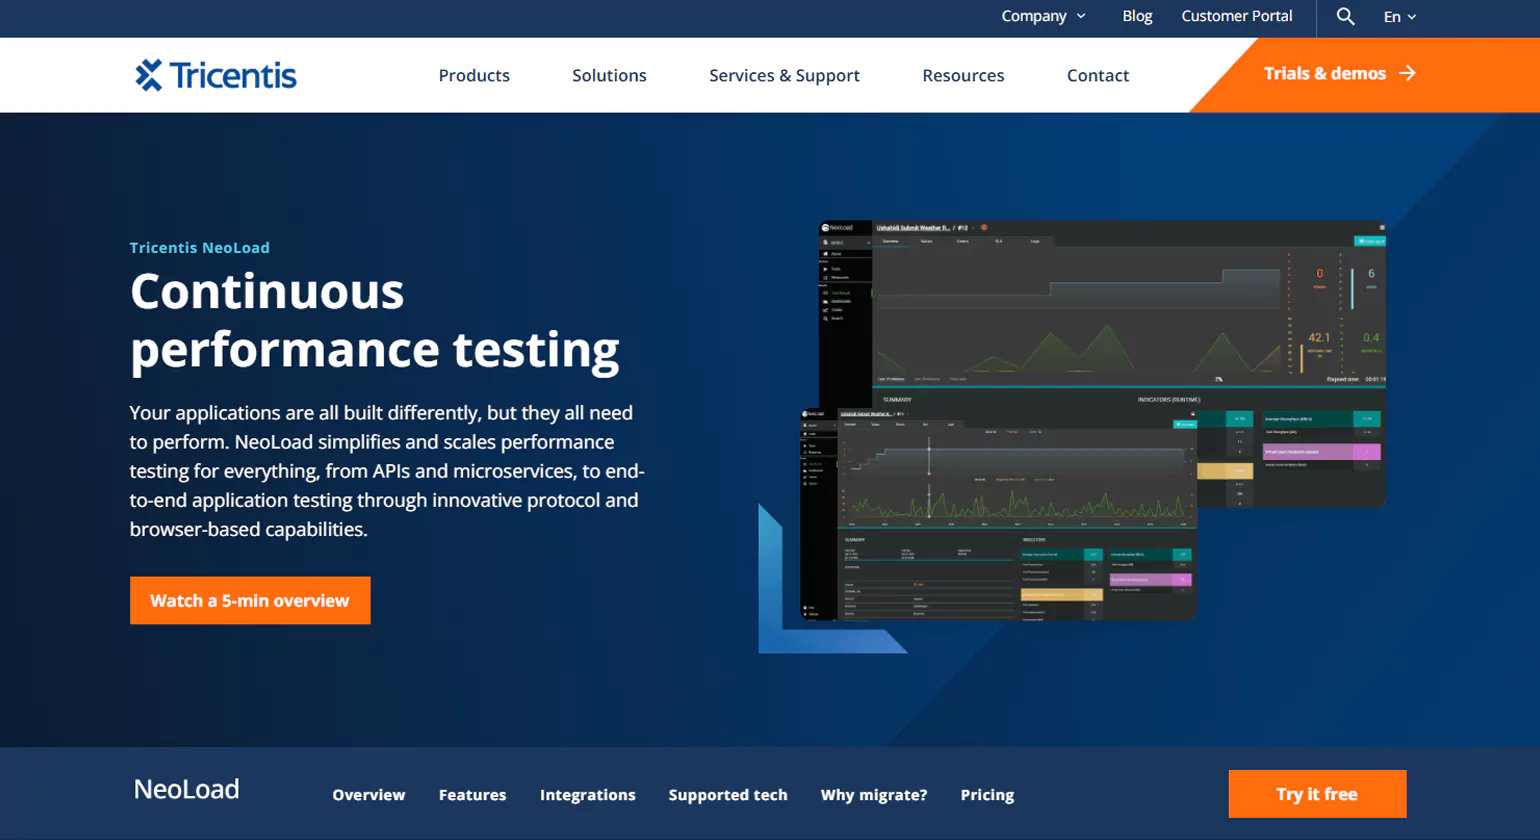
4.NeoLoad
NeoLoad is a leading load Website Performance testing tool and website designed for testing complex web and mobile applications. It offers an easy-to-use interface with drag-and-drop features for creating and executing performance tests. NeoLoad supports integration with CI/CD tools like Jenkins and provides real-time analytics and dashboards, allowing teams to detect performance bottlenecks early in the backend development cycle.
5. Apache Bench
Apache Bench (ab) is a simple command-line tool for load testing HTTP servers. It’s lightweight and quick, making it a useful tool for conducting basic performance tests or benchmarks. Although it lacks advanced features compared to other tools, Apache Bench is still popular for its simplicity and speed in conducting small-scale Performance Test Tools.
6. BlazeMeter
BlazeMeter is a cloud-based performance testing platform that integrates seamlessly with JMeter. It is designed to handle large-scale load testing and can simulate traffic from multiple regions around the globe. BlazeMeter is ideal for testing web, mobile, and API applications, offering real-time analytics and in-depth reporting. It is often used for performance testing in agile and DevOps environments, allowing teams to test performance continuously.
7. WebLOAD
WebLOAD is an enterprise-grade Website Performance Test Tool designed for load and stress testing of web and mobile applications. It supports a variety of protocols, such as HTTP/HTTPS, SOAP, and REST, and provides robust reporting and analytics. WebLOAD is particularly known for its ability to handle complex test scenarios with dynamic content, providing accurate insights into application performance.
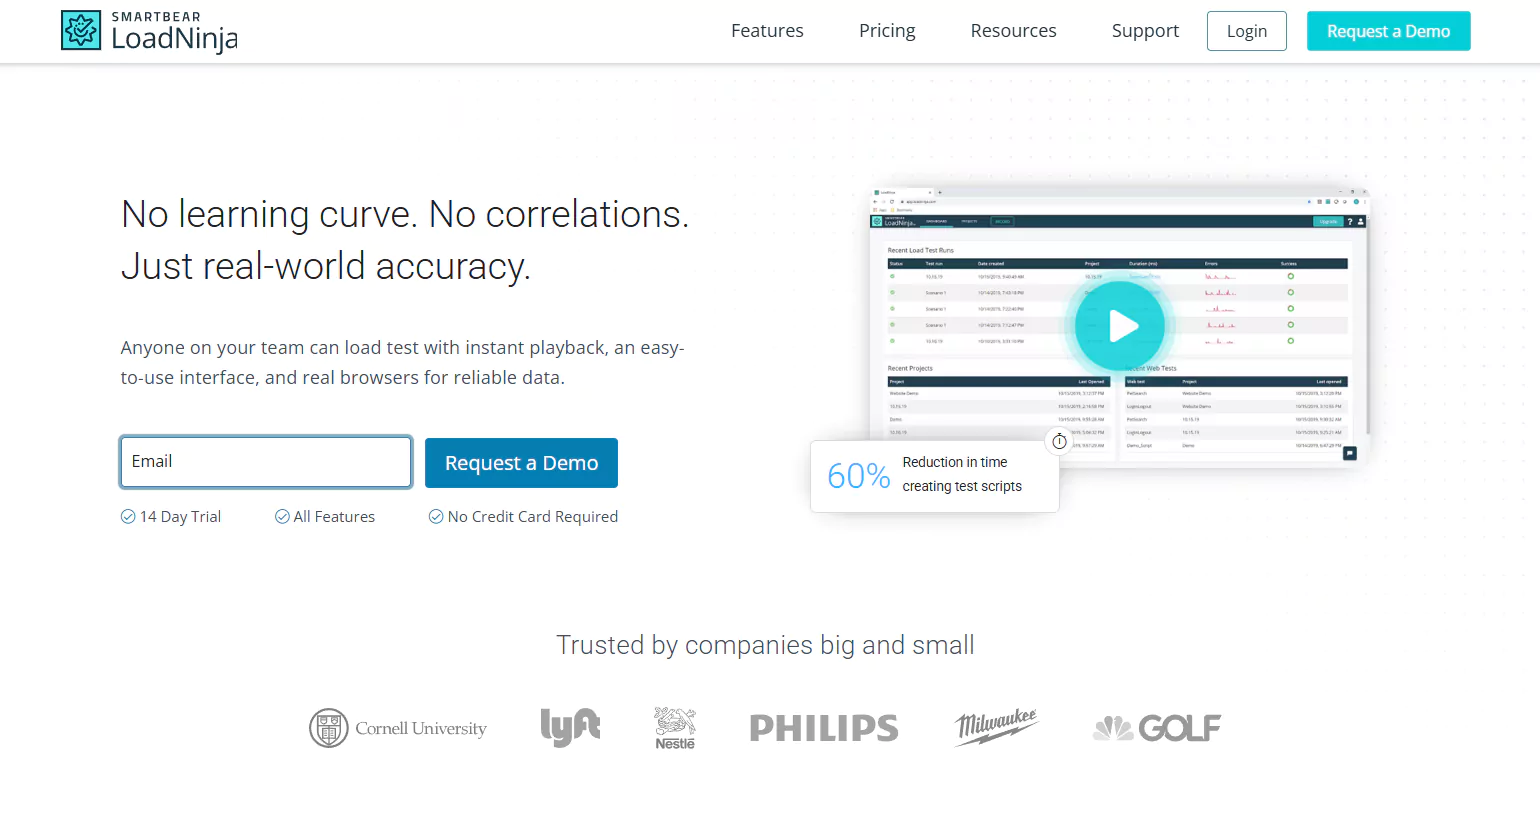
8. LoadNinja
LoadNinja is a cloud-based load testing tool that allows users to simulate real-world traffic without writing any code. It offers features like real-time reporting and detailed analytics. LoadNinja focuses on web and mobile apps, providing easy-to-use tools for generating and analyzing tests. It allows testing without requiring users to handle complex scripting, making it a good choice for testers who prefer simplicity.
9. AppDynamics
AppDynamics is an application performance management (APM) tool that helps monitor and analyze performance in real-time. Although it is primarily focused on monitoring application health, it also supports performance testing in production environments. AppDynamics tracks key performance metrics, such as response times, throughput, and error rates, and provides insights into server and application behavior under load.
10. Rational Performance Tester
IBM’s Rational Performance Tester is a comprehensive solution for automating load and performance testing of web and enterprise applications. It allows testers to simulate various user activities and monitor performance under different conditions. The tool provides detailed reports on response times, throughput, and system resource usage, and it integrates well with other IBM software products for continuous testing in DevOps pipelines.
Key Features to Look for in Website Performance Testing Tools

Choosing the right and best Website performance testing tools is essential for ensuring that your application can perform well under varying loads, maintain user satisfaction, and meet business goals. Performance testing encompasses load, stress, scalability, and endurance tests, each with distinct requirements and objectives.
1. Define Your Testing Objectives
Before selecting a tool, it’s important to clarify your performance testing goals. Do you need to test how many users your application can handle at once (load testing)? Or are you more focused on identifying the breaking point (stress testing)? Perhaps you need to assess long-term stability (endurance testing) or test scalability to ensure the app can grow as traffic increases.
2. Compatibility with Your Application Stack
The Performance Test Tools must integrate seamlessly with the technologies and tools your application is built on. Check whether the tool supports:
The programming languages you use (e.g., Java, Python, .NET)
Web frameworks (e.g., Angular, React)
Servers and databases
Cloud environments or containerized systems (like Kubernetes or Docker)
Continuous integration (CI) tools, as you may want to automate tests as part of your deployment pipeline.
3. Ease of Use and Setup
Different tools vary in complexity. Some require deep technical knowledge and scripting, while others come with easy-to-use graphical user interfaces (GUIs) or low-code interfaces. When evaluating tools, consider:
Learning Curve: Does the tool offer a simple setup process or require significant time to master?
Scriptability: Some tools allow for advanced scripting for custom scenarios, while others rely on predefined templates.
GUI vs. CLI: If you prefer working with a GUI, tools like LoadRunner and NeoLoad may appeal to you, while JMeter and Gatling are more script-based.
4. Scalability and Load Generation
This tools need to simulate multiple virtual users accessing your system simultaneously. For high-traffic applications, the tool must support a large number of virtual users without impacting system performance. Look for features such as:
Virtual User Capacity: How many virtual users can the tool simulate? Can it scale to meet your testing needs?
Cloud-Based Load Generation: Some tools allow you to distribute the load testing across different geographical locations by leveraging cloud infrastructure, which is helpful for global applications.
5. Real-Time Monitoring and Analytics
During and after tests, you’ll need actionable insights. The testing tools in software evaluation should provide comprehensive reporting, real-time monitoring, and advanced analytics. Consider:
- Real-Time Data: Tools like JMeter and LoadRunner offer dashboards that allow you to monitor the test in real time.
Detailed Reports: Look for reports that highlight response times, throughput, error rates, and bottlenecks.
Visualizations: Interactive graphs and charts that make it easier to identify performance issues.
Alerts and Notifications: Some tools can alert you to performance degradation during testing.
6. Budget and Licensing
While some testing tools for performance are open-source and free (e.g., JMeter, Gatling), others require a paid license (e.g., LoadRunner, NeoLoad). The cost of these tools can vary significantly based on:
Pricing Models: Some tools charge based on the number of virtual users, others may have a flat rate or tiered pricing based on the features and the scale of testing.
Support and Upgrades: Paid tools often offer better support and regular updates. Consider whether support and maintenance are important for your team.
Conclusion
Website performance testing tools are essential for ensuring your site stays fast, stable, and user-friendly. By continuously monitoring speed, load capacity, and overall responsiveness, these tools help identify issues before they affect real users. They also guide optimization efforts, making it easier to improve conversions, SEO rankings, and customer satisfaction. Whether your website handles light traffic or high-demand workloads, leveraging performance testing tools ensures reliable experiences across all devices and conditions, ultimately supporting your site’s long-term growth and success.
FAQs
1. What is Website performance testing?
Performance testing assesses an application’s speed, stability, scalability, and responsiveness under varying user loads. It helps detect performance bottlenecks, ensures reliability, and enhances user experience, making sure the software performs efficiently before its final release.
2. What are the top performance testing tools?
Top testing solutions like JMeter, LoadRunner, Gatling, NeoLoad, and BlazeMeter simulate user load to assess application performance, detect bottlenecks, and ensure stability under peak traffic, ensuring software reliability and scalability across various environments and conditions.
3. What is Apache JMeter?
Apache JMeter is an open-source performance testing tool that simulates multiple users to evaluate web application performance. It supports various protocols, offers customization, and is widely used for load, stress, and functional testing across different environments.
4. What is LoadRunner?
LoadRunner, by Micro Focus, is a robust performance testing tool that simulates thousands of users to assess application behavior under load. It supports multiple protocols, offers real-time monitoring, and provides insights to identify bottlenecks and optimize system performance.
5. Why use performance testing tools?
performance testing solutions simulate real-world user loads to detect bottlenecks, enhance stability, and boost application speed. They help prevent crashes and downtime, ensuring a seamless user experience and maintaining a business’s competitive edge through reliable software performance.
6. How do I choose a performance testing tool?
Choose a performance testing tool based on your app type, budget, protocol support, usability, and integration needs. Evaluate scalability, reporting, and community support. Match the tool to your team’s skills and project goals to identify and resolve performance issues.